|
1
|
|
|
2
|
|
|
3
|
|
|
4
|
|
|
5
|
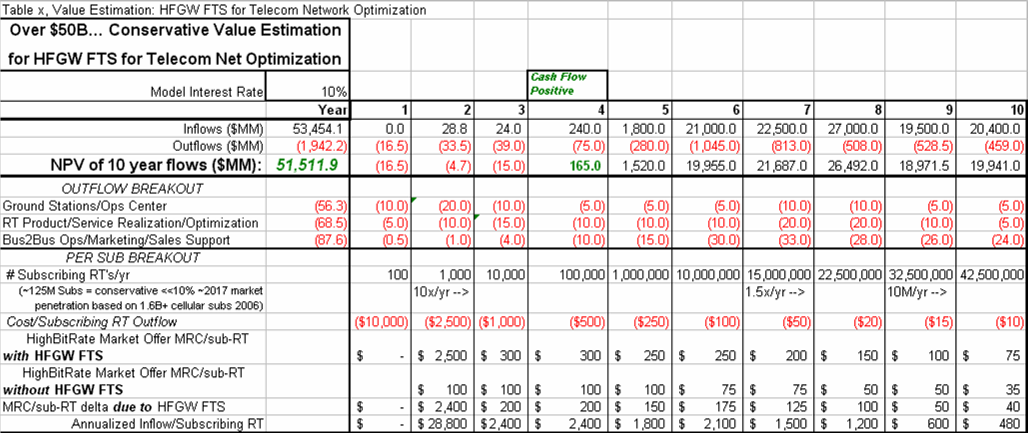
- Cash Flow Positive on Year 4 -
four years from mature, lab proven technology
- Net Present Value estimate based on 10 years of operation: $ 51.5
Billion
|
|
6
|
|
|
7
|
|
|
8
|
|
|
9
|
- How much will it cost?
- To fund detection and generation experiments (Phase 1 & 2) for proof
of concept:
- Plans and Specifications 4 Million
- Fabrication 6 Million
- Test 5 Million
- Cushion 5 Million
- Proof of Concept Phase 20
Million (for both experiments)
- HFGW FTS Infrastructure Development,
Phase 3:
- Development of HFGW FTS receivers for cell phone use 25 Million
- Manufacture of cell phone HFGW
FTS receivers 25 Million
- Four stations @ 25 Million each 100 Million
- Total Developmental Cost (Phases 1,2,& 3) 170 Million
- How much and how will it pay back?
- Licensing and Technical Support:
- 5% of 50 Billion in 10 years
or 2.5 Billion
|
|
10
|
|
|
11
|
- For search space improvements we choose 25%.
- For higher density phase encoding due to phase noise improvement, we
choose 200%.
- For frequency-based improvements, we choose 25% for an overall raw
capacity improvement floor of 250%.
- For better beam-forming due to precision positioning, we choose not to
include this technology in the low side estimate since it is somewhat
speculative. For the high side estimate 50% is used.
- For cell-handoff and precision Quality of Service (QoS) improvements due
to precision timing, we choose an overall value improvement of
200%. Here, we apply the term QoS
to network usage prioritization and predictability with respect to
performance parameters including delay, error rate, and throughput.
- Even as a floor, we significantly reduce these expected low-side
improvements prior to further use in our dollar valuation model to
reinforce its conservative nature.
|
|
12
|
- Applying these multipliers to a conventional High Bit Rate Wireless
Market Offer (conservatively—for this model—priced at $100/month/2Mbps),
we obtain a reference MRC/subscriber low-side value added due to the
HFGW FTS of $275 (Table 2).
- Note that MRC = Monthly Recurring Charge. This includes a 25% $/mbps discount
from conventional costs due to supply increase and demand elasticity.
- Further, in all significant cash flows (post year 2), we utilize a still
more conservative estimate ranging from ~75-15% of this reference value.
|
|
13
|
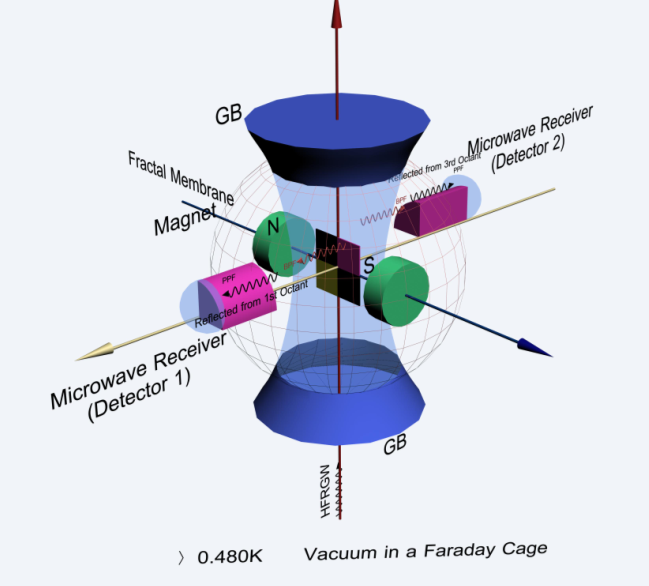
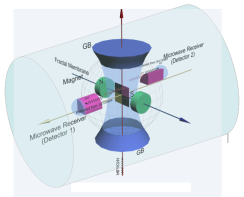
- First Step – Design, develop, fund, and perform HFGW detection
experiments to detect background (relic) GW radiation to prove detection
technology.
- One example approach: Li, Baker, & Chen, 2007
- Second Step – Design, develop, fund, and perform HFGW generation
experiments to generate GW radiation in a laboratory environment.
- One example approach: Woods & Baker, 2005
- Use previously proven detection approach
- Near Term Development – Develop and miniaturize HFGW technology for use
in the FTS application.
- Long Term Follow-on – Develop HFGW technology for use as a communication
medium.
|

 Notes
Notes